Waymo Challenge
The Waymo Challenge
In August 2019, Waymo shared a portion of their self-driving car’s data as the Waymo Open Dataset. The data set contains LIDAR point clouds and images from the 5 cameras on the Waymo test cars. I previously used this dataset as additional training data for my entry in the Comma.ai Speed Prediction Challenge. In March 2020, Waymo released a major update to their dataset and announced the Waymo Open Dataset Challenges. There were five challenges:
- 2D Detection
- 2D Tracking
- 3D Detection
- 3D Tracking
- 3D Detection Domain Adaptation
The 2D Detection Challenge
Since most of my prior experience was with 2D computer vision tasks, I decided to try my hand at the 2D Detection challenge. The 2D detection challenge falls under the computer vision task of Object Detection. Object detection is a more difficult task than the canonical computer vision task of image recognition - in image recognition the model only has to choose which of the supplied labels most applies to the image overall, but in object detection, the model has to localize the objects in the image.
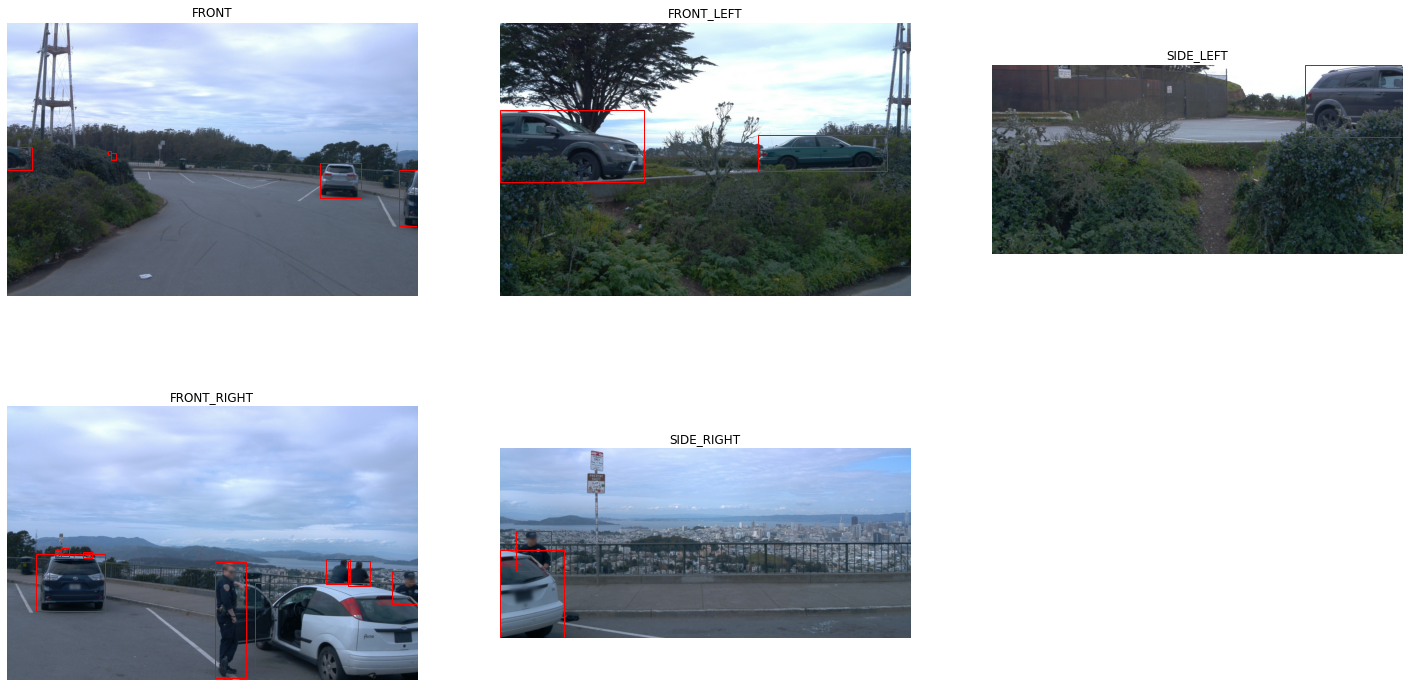
Specifically for the Waymo Challenge, the task was to draw bounding boxes around the vehicles, bikes and pedestrians:

There are 5 cameras on the Waymo test vehicle - the front, front right and front left cameras with a resolution of 1920x1280 and the side right and side left cameras with a resolution of 1920x886.
How object detection works
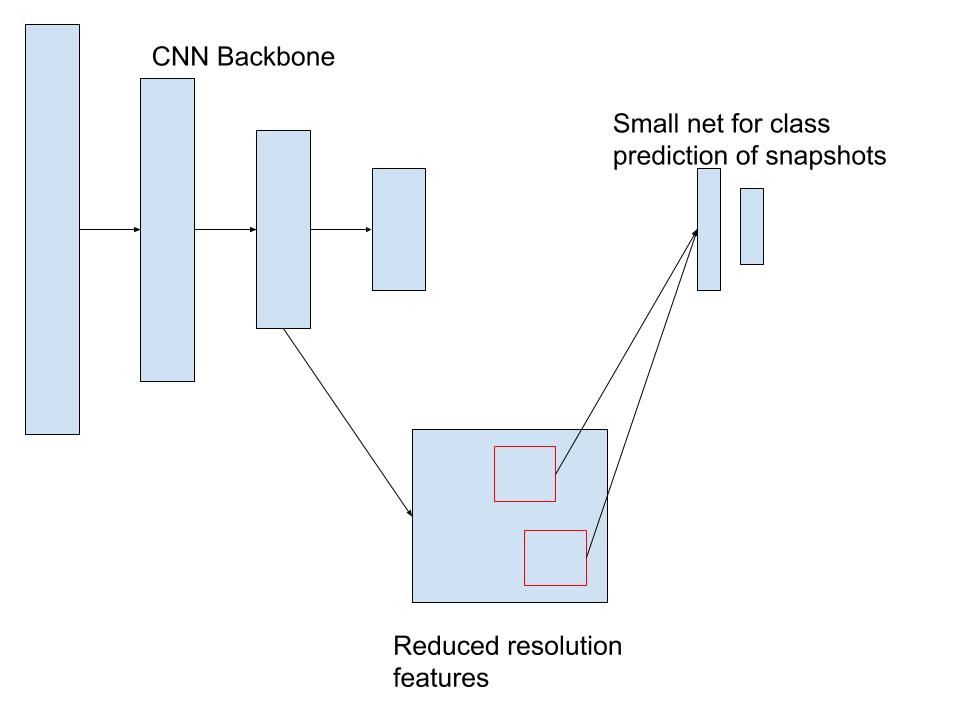
Almost all object detection models are composed of 2 parts:
- A backbone CNN to extract reduced resolution feature maps
- A smaller CNN to predict the objectness of regions of the feature maps

The backbone CNN, usually lifted from a high performing ImageNet classification model produces reduced resolution “images”. Then many regions, tiled across the “image”, are snapshotted and fed into the smaller CNN. The regions of “image” where the smaller CNN fires strongly are the predicted boxes of the overall network.
High performing object detection networks add a number of wrinkles on top of this basic scheme, such as running the smaller CNN over feature maps extracted at multiple resolutions to handle detecting objects of different sizes or adding another small CNN to suggest small offsets from the location implied by the where the snapshot was taken.
Choosing a Model
After I decided to tackle the 2D Detection challenge, I did a survey of the top models and honed in on 3 top choices:
SpineNet
SpineNet is a very interesting take on the stack more layers approach to machine learning. State of the art object detection models snapshot at different resolutions of feature maps, but the higher resolution feature maps are taken earlier in the backbone, which means that they’re the result of less processing. SpineNet permutes a standard ResNet-50 architecture so that there are feature maps of multiple resolutions at the end of the network, so that all the feature maps can be the result of all 50 layers.
YOLOv3
YOLO (You Only Look Once) is a series of object detection models designed for high speed on commodity hardware. The project focuses on hardware utilization to guide its design choices, over the raw FLOPs count used by others.
EfficientDet
EfficientDet is a family of models built on top of the EfficientNet family of image recognition models. It uses the EfficientNet models as the CNN backbone and introduces a new method of aggregating information across resolution scales, the BiFPN.
SpineNet seemed like a promising candidate from the paper, but while it was technically opensource, it was written to be run on TPUs and there wasn’t a community trying to leverage it. YOLOv3 was designed to be run on commodity GPUs, had a large community and active support from the authors, but it didn’t have state of the art performance and was written in a custom ML framework, darknet. EfficientDet did have the state of the art performance. It was open source, supported by the author and a substantial community and written in TensorFlow (the framework I have the most experience with). I decided to focus on EfficientDet.
Training EfficientDet
After fighting the usual fires trying to get a new model working (formatting the data the way the model wants it, difficulties getting the dependencies installed), I was able to finetune the smallest EfficientDet model. The smallest EfficientDet, d0, is trained on the standard COCO dataset, on which it gets an AP of 33.8%. Unfortunately, finetuning from that checkpoint on the Waymo dataset resulted in much worse performance.
I was able to apply a fact that I had previously learned working on self-driving car data - presenting the frames in order is really bad for performance. I shuffled my input data better and got much improved performance. I also changed the learning rate to match the (smaller) batch size that I was training at and got better performance still. At this point I hit a wall at only 13% AP. Waymo had preseeded the leaderboard with 2 dummy entries that had ~20% AP, so this clearly wasn’t good enough.
I was training over a period of 10 epochs and the AP basically plateaued after the first 1 or 2 epochs. I took a look at the code and found that EfficientDet uses a cosine decay rule, so I wondered whether my issue was that the learning rate was falling off too fast. I switched it out for a constant learning rate, but it had roughly the same performance. I also tried replacing the default SGD optimizer with an ADAM optimizer, which also had roughly the same performance.
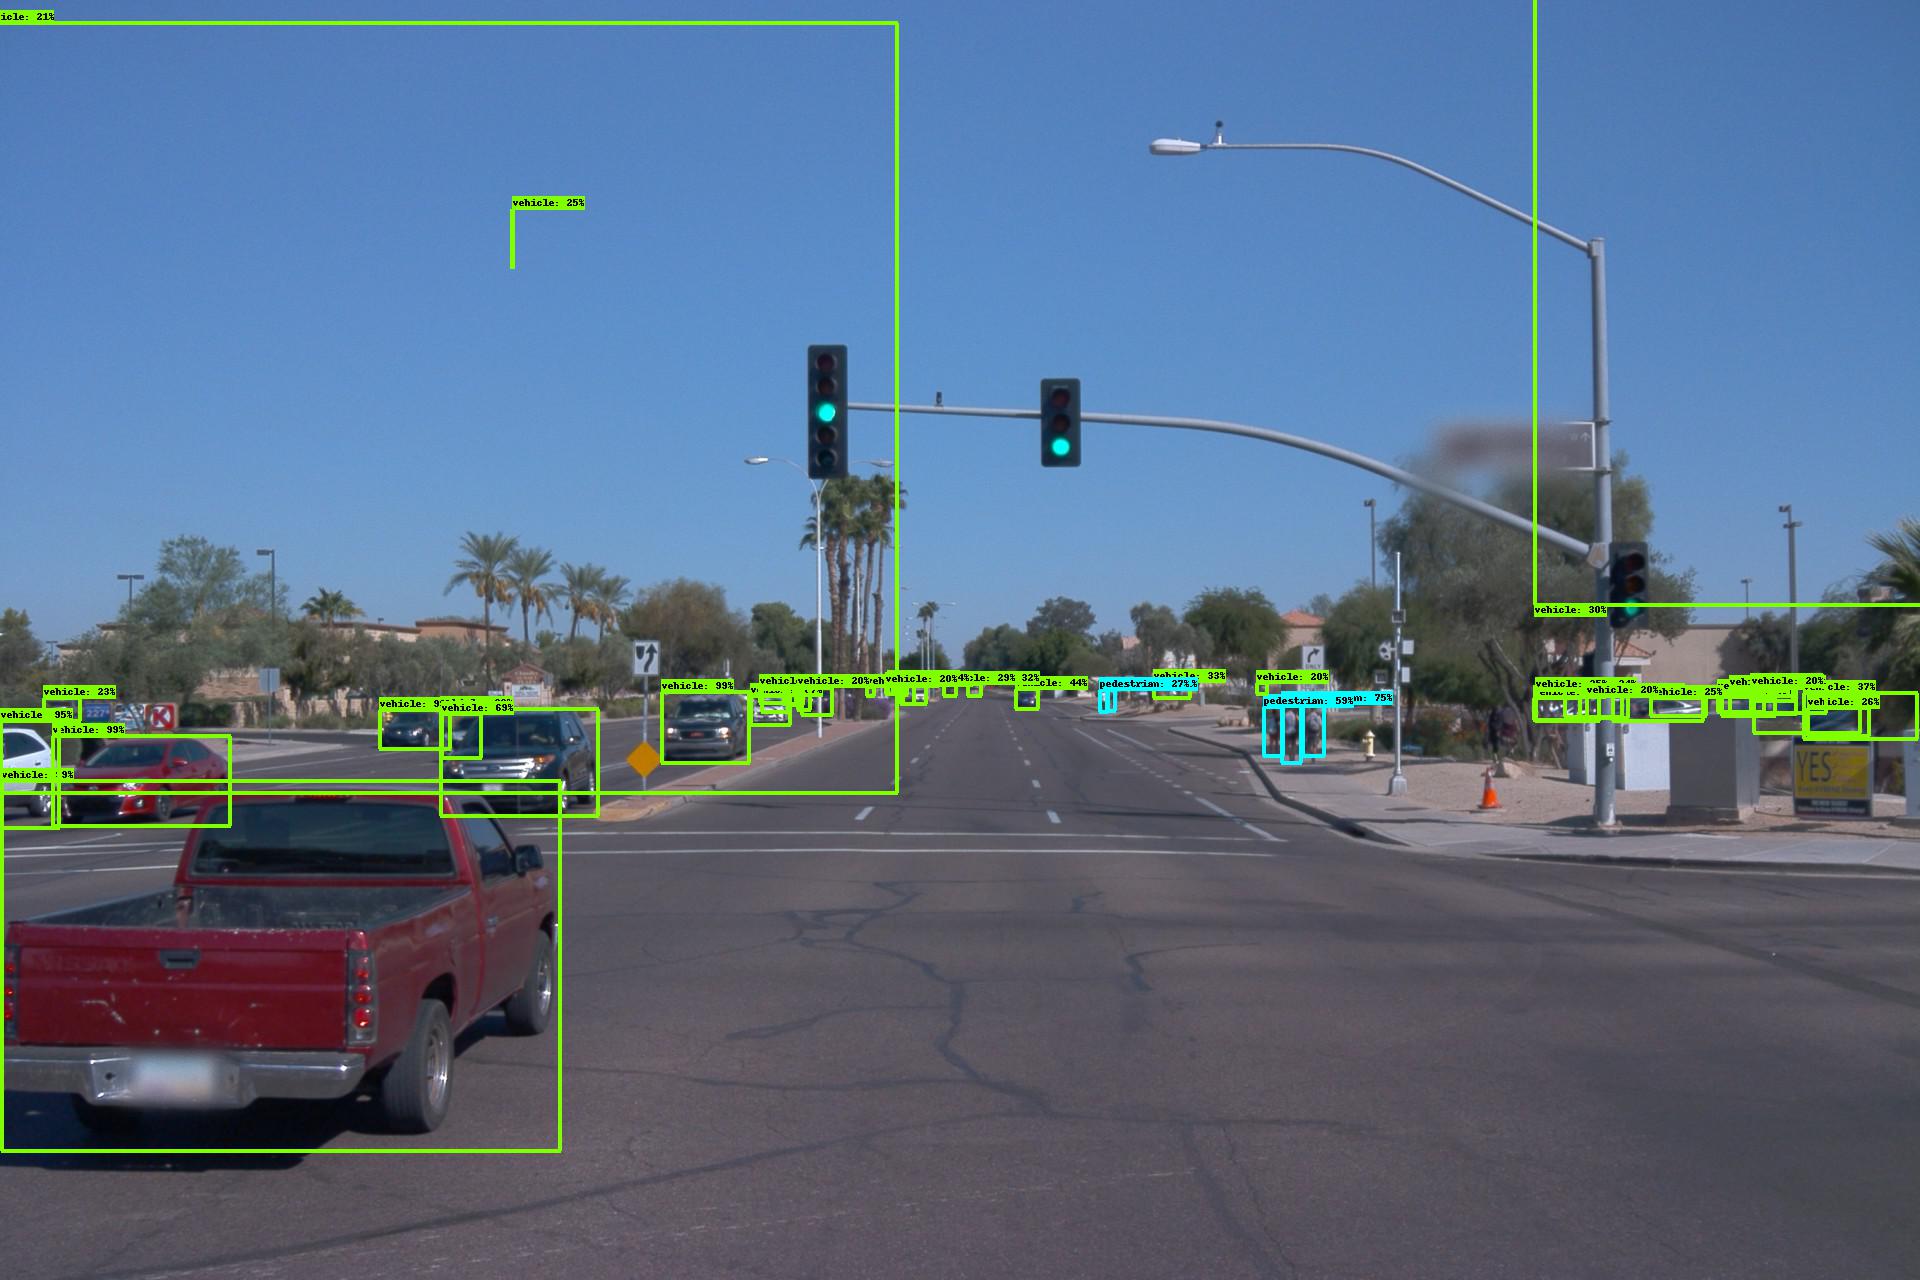
At this point, the deficit versus the COCO AP score had me concerned there was a bug in my code, so I dumped an image with the model’s bounding boxes:

Which made it clear that the model was basically learning, but it did have weird issues with boxes in the sky. Interestingly, the equivalent boxes from the side cameras (with their different aspect ratio) didn’t have the weird sky boxes.
I also wrote a tool to dump my tfrecords to json so I could see if there was some obvious flaw in my tfrecord converter, but there wasn’t any.
At this point, faced with consistently worse performance than the COCO dataset, I was concerned that my “finetuning” process was actually making the model worse at detecting things. The COCO dataset has a bunch of categories that overlap with the Waymo dataset (car, truck -> vehicle), so I was able to write a translation layer that converted the COCO labels to Waymo labels. With the translation layer, I was able to see what the model’s performance was before finetuning. EfficientDet d0, the one I was training, had an AP of 6% just mapping the COCO classes, but an AP of 13% after finetuning. The middle EfficientDet (d4) had a mapped AP of 16% and the largest (d7) had a mapped AP of 19%.
I also took a look at the pictures that comprised the COCO dataset and discovered that the objects in it were usually much larger than the objects in the Waymo dataset.
Between these findings, it was pretty clear that:
- Finetuning was working (6% -> 13% AP)
- The Waymo dataset was much more challenging that the COCO dataset
- Larger models would perform better
Unfortunately there were issues running larger models on the EfficientDet codebase. It wasn’t designed for multi-gpu training - I attempted to use tf.distribute.Strategy to parallelize the training, but some bug stopped it from working. Another user’s attempted workaround resulted in my model failing with an out of memory error. More importantly, EfficientDet was originally designed for TPUs and had some bug that caused much more memory usage on GPU. On TPUs, the largest model could be run with a batchsize of 4 per 16 gb node. On GPUs even with a batchsize of 1, the medium model couldn’t be trained.
At this point, the leaderboard had not only the Waymo dummy entries at 20% AP, but also some competitive scores at ~60% AP. It seemed like I might be able to finetune a larger EfficientDet to beat the dummy entry scores, but I couldn’t possibly put together a really competitive score.
YOLOv4
Fortunately, at this point the YOLOv4 paper came out. It promised better performance than EfficientDet and emphasized that it was trainable on commodity hardware.
Unfortunately, YOLOv4 isn’t implemented in a standard framework like Tensorflow or Pytorch, it’s implemented in a custom framework called DarkNet. Getting it working required learning about CMake and Make, fixing a bug that prevented it from compiling with half-precision support and painfully learning that Make doesn’t natively take advantage of multi-core support. It also takes in data as individual files, not optimized formats like tfrecord. I was forced to move my data to my SSD to get full performance.
With all the setup difficulties sorted, I was able to train a YOLOv4 network with the recommended setup up. I trained for several days and got a network with a performance of 34%! That was much better than the 13% I’d gotten with EfficientDet. Unfortunately, the default number that YOLO reports is the AP50 number, a less stringent test than the AP number that EfficientDet uses. EfficientDet also reports the AP50 number, so I was able to guesstimate that my 34% would give me a true AP of around 20%. That was maybe high enough to beat Waymo’s dummy entries, but nowhere near high enough to be competitive.
However, at this point, I was basically out of ideas for how to get a truly competitive score. Since the ~20% AP was the highest number I had yet gotten, I put together the code necessary to turn the YOLO predictions into the Waymo format and uploaded my validation predictions. Their system informed me that I had a score of 44%!
Back to EfficientDet
At this point, I knew that my pessimism about the performance of my models was wrong - the Waymo metric was way more forgiving than either of the metrics I’d been paying attention to. Now the job was to build on the models I had in order to beat the fore-runners. Of the two models, EfficientDet had the more compelling story for ramping up performance - it was already a family of models giving you a FLOPs/AP tradeoff curve.
It had been around a month since I’d looked into the EfficientDet github and I hoped that the issues I’d seen before had been solved. There was some progress - for instance it now had support for half-precision floats, doubling the possible batch size. There was also support for multi-gpu training via horovod. Unfortunately, despite these improvements I was only able to train up to the d3 model. Also, there was some performance regression. Either changes to the codebase or in the new version of Tensorflow I was using, meant that XLA was no longer able to increase training performance anywhere near as much. Previously I was getting 65-70 examples per second for the d0 model and now I was down to only 30. The train speed with the 8x larger d3 model was correspondingly very slow, so I decided to try to optimize the YOLO performance instead.
Back to Yolo
The YOLO repo has a whole section dedicated to the question “how do I improve performance”? The number one suggestion is to increase the resolution you run the model at, either only at test time or at train time for higher performance still. It was very fast to test this at test time resolution increase - the 34% AP50 I’d gotten before was running at 416x416 improved to 43% just by running the model at 608x608 at test time. Using the Waymo scoring metric, that was probably good for 55%. With that test, it was clear that I had a clear path to beating the 60ish% numbers that were topping the leaderboards.
The other major suggestion in the YOLO readme is to recalculate the anchors for your specific dataset. I did so and my test run suggested it was good for a 1% improvement in AP50. I also experimentally verified that training at higher resolutions gave better performance than increasing test resolution - a model I trained and tested at 512x512 performed better than the model trained at 416x416 and tested at 512x512.
At this point, I was out of recommended ways to improve performance. My first thought for how to improve performance was a clue I had seen in my initial validation checks on EfficientDet. The images I had dumped had a bunch of false positive detections in the sky area. Or, more accurately, only some of the images I had dumped had the false positives. The front facing cameras with resolution 1920x1280 had the false positives, but the side facing cameras with resolution 1920x886 did not. Since both of these aspect ratios were being resized into a square, the shape of a car would be quite different. Further, there would be different base rates for objects to appear in different parts of the image. I decided to try training two different models, one for each aspect ratio.
Unfortunately, training separate models didn’t improve performance. Possibly the fact that these models had to be trained on ~half as much data cancelled out the benefits from having more consistent object shapes, or possibly the inconsistency just wasn’t much of an issue in the first place.
The issue of resizing non-square images into squares did give me another idea - squashing these images into squares was probably causing much worse performance in the horizontal axis than the vertical axis, since the resizing was throwing away a bunch of information. I chose to use a resolution that was a compromise between the two, weighted by the number of cameras using each.
The Last Week
At this point, there was about one week left until the competition deadline, so I only had time for one large training run. Also, more and more people were posting their scores on the leaderboard and there was a new number one. I looked at the number one submission and it said that it used test time augmentation (TTA). TTA is a technique for improving a model’s performance by augmenting the input, running all the augmented inputs through the model, then aggregating the results. Unfortunately, YOLO didn’t have any support for TTA. Thus, I had a two part plan for the last week of the competition - my GPUs would work hard training the highest resolution model I could and I would work hard adding support for TTA.
Training went well, producing the strongest model I had yet seen, although I didn’t get the training protocol quite correct. I had previously seen model performance top out somewhere between 16k and 24k iterations. I set up the training run for 20k iterations, but this run didn’t top out the way I expected it to, forcing me to add additional iterations on the end. YOLO recommends dropping down the learning rate by a factor of 10 at the 80% and 90% marks of training, so adding additional iterations after a training run is complete raises the question of what learning rate to use. I ended up using the 1/10 learning rate for another 8k iterations which worked ok.
Additionally, after I finished the 20k iteration training run, I realized that I hadn’t quite chosen the best resolution to train at. I had arbitrarily decided to run the model at half resolution, with 960 pixels on the long axis. While that image size was large enough to force me down to a minibatch size of one image, it wasn’t actually using all of my GPU memory. I was able to scale up the resolution by ~10% before running out of RAM, so the final 8k iterations were run at that higher resolution to squeeze the maximum possible performance.
Adding simple TTA support to the YOLO codebase was very easy. I modified the code to run the model twice for each image, once normal and once with a left-right flip. Then I ran the combined detections through the non-max suppression function. However, adding support for multi-resolution augmentation proved more complicated. Merely adding support took several days with my extremely rusty c skills, but when I was done, the augmentation actually reduced performance. I’m pretty sure the issue was that I was using a very naive algorithm for combining the results of the various augmentations. I found a paper discussing more advanced algorithms, but I wasn’t able to implement them in time.
Final Results, Final Thoughts
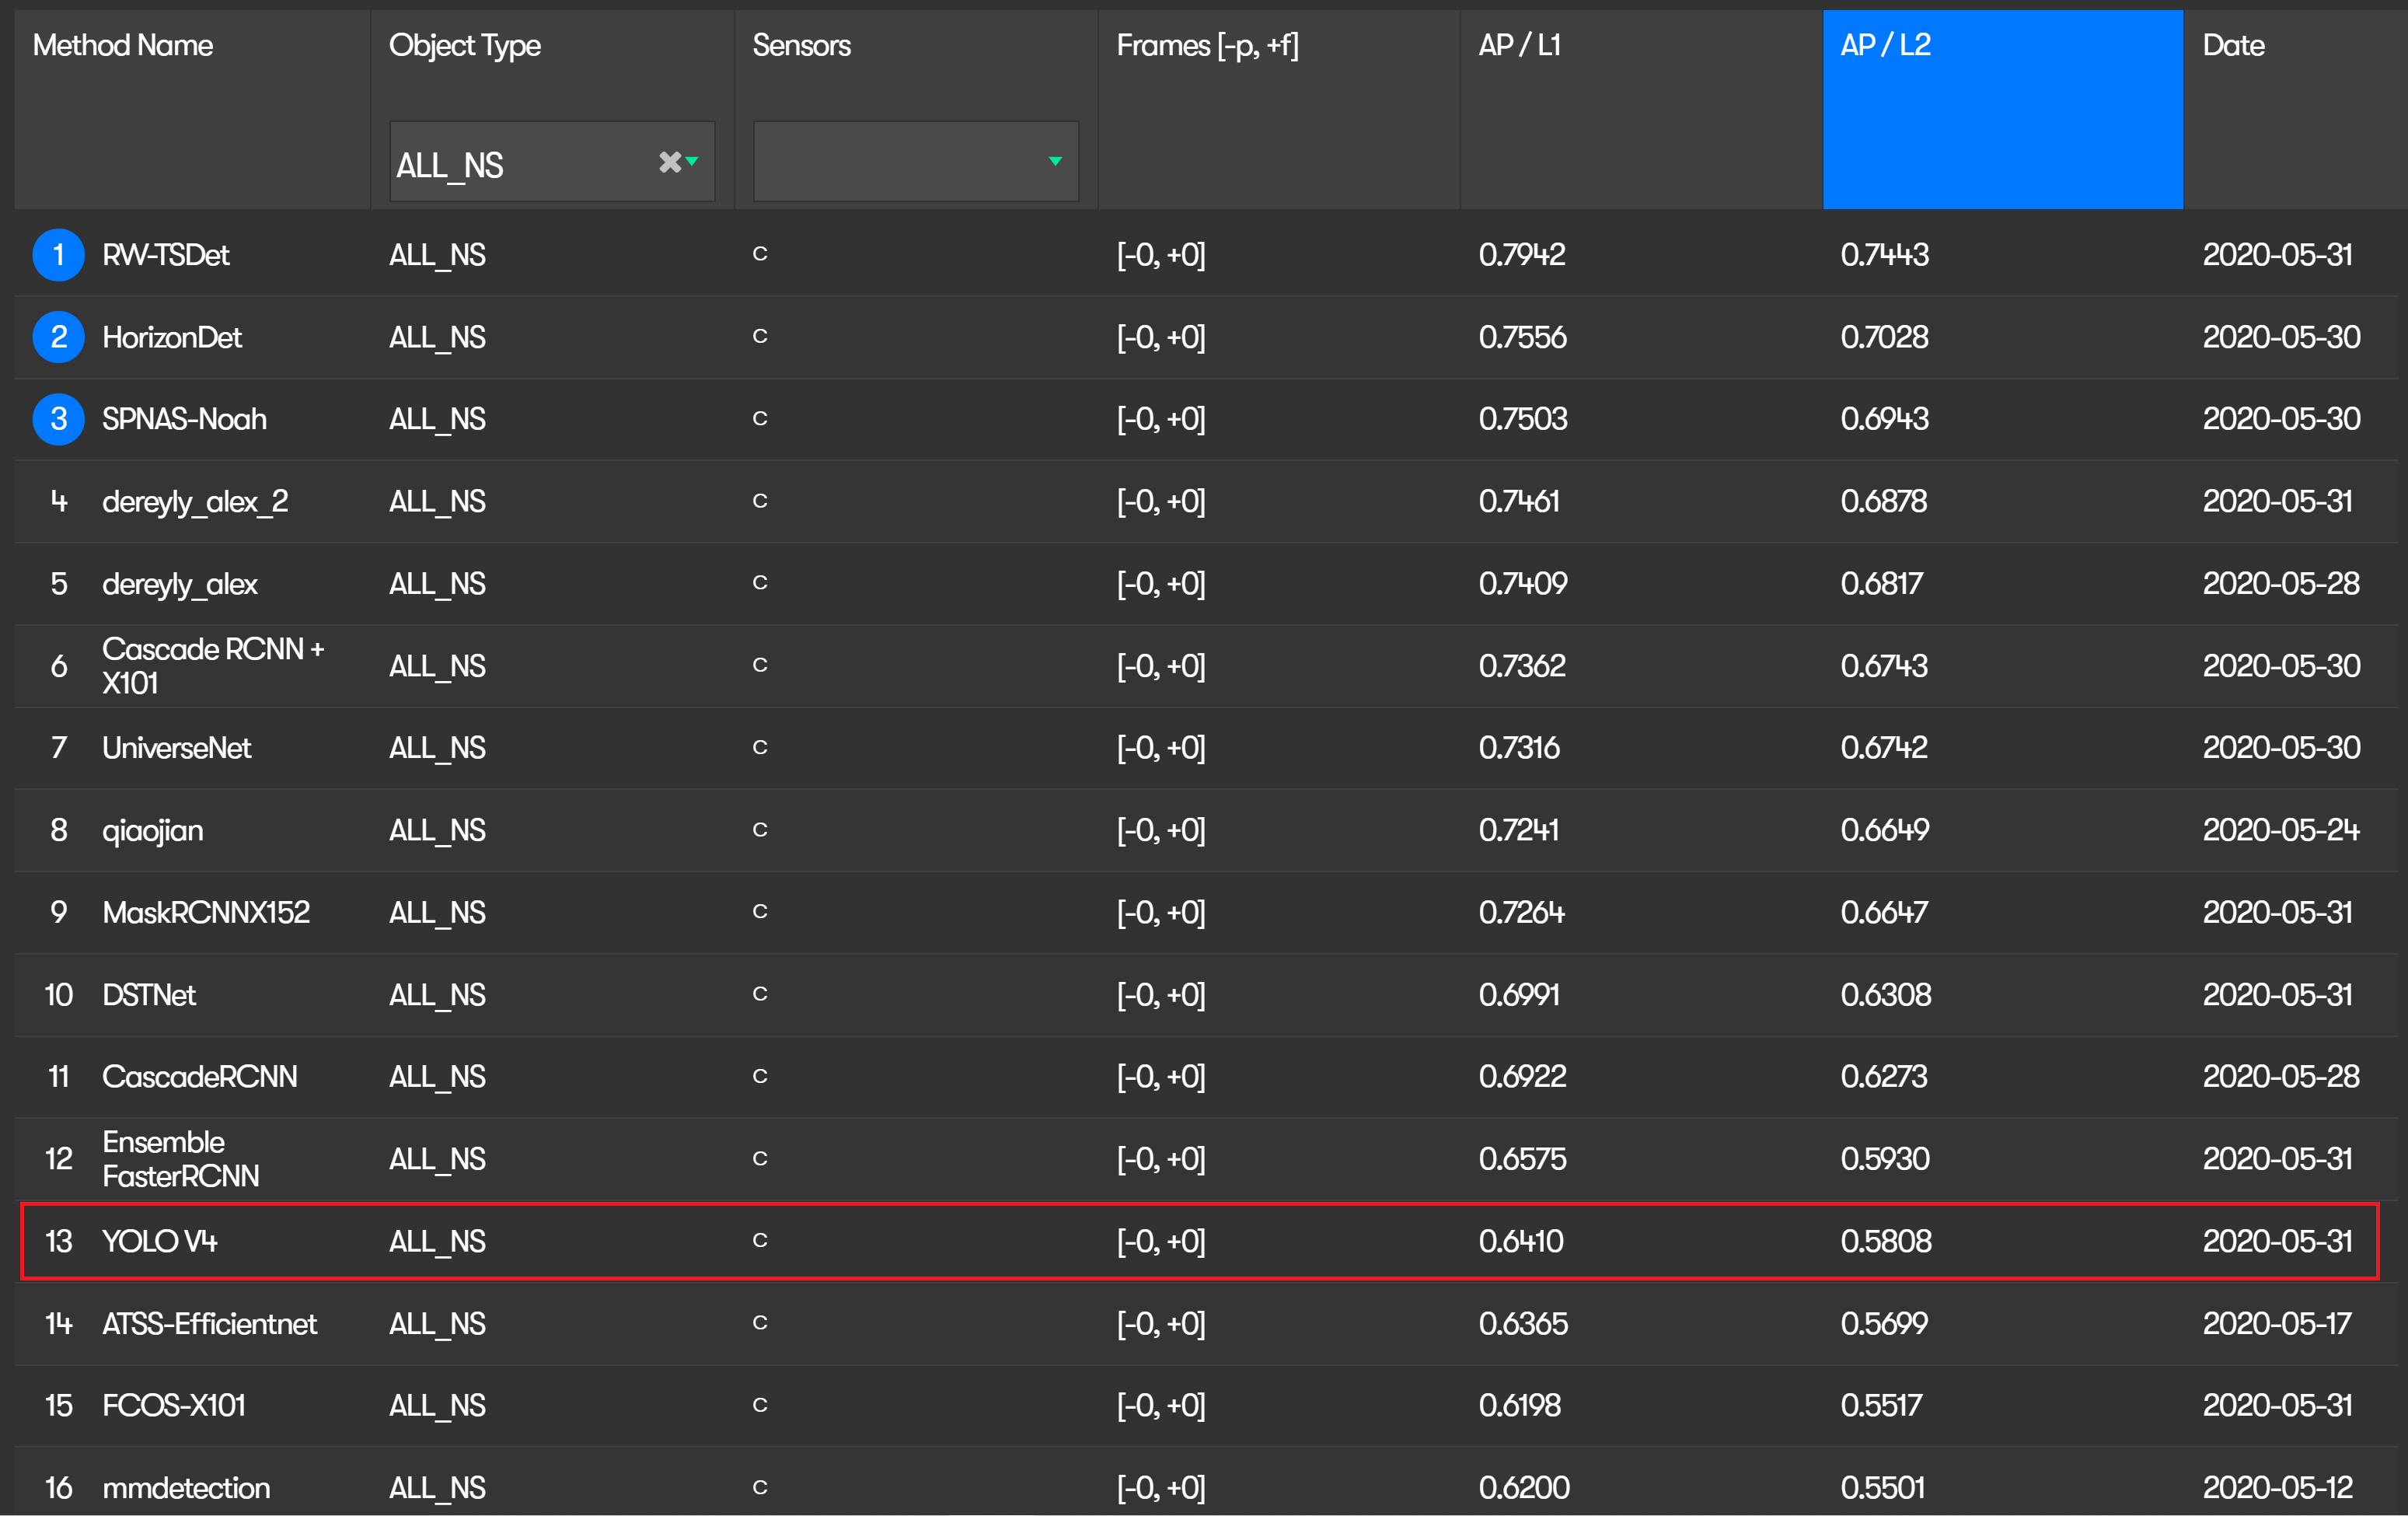
With my final model and the left-right flip test time augmentation, my submission was able to get a score of 64%! That was a little bit better than the low 60% results I had seen top the leaderboard early on that I had set as my target to beat. At the time I submitted I was in 7th place and by the time the contest completed, my submission was in 13th place.

There are a bunch of directions to explore for greater performance. Most obviously, getting multi-resolution TTA working would be a big boost. Most of the top submissions to the challenge use TTA or are ensembles of multiple models, so clearly it’s an important part of the puzzle. Another easy bet is fixing the training setup - training from the start with the highest possible resolution and for a longer period.
A more exotic possibility that I’m excited about is pseudo labelling. The basic version of this is based on the fact that the Waymo dataset contains a lot of imagery that doesn’t come with bounding boxes for training, which they released for their Domain Adaptation challenge. Using a model to produce labels on those images for training another model would nearly double the amount of training data available.
The advanced version of this is based on the fact that the Waymo dataset uses an extremely small set of classes - vehicle, bike, pedestrian and sign. The sign class doesn’t even have any data. The COCO dataset on the other hand, has more specific classes, particularly for the vehicle class. I leveraged this class overlap to confirm that my finetuning of the EfficientDet model was working, but it could also be used to have the EfficientDet model produce more finegrained labels for the Waymo dataset. Having more finegrained labels would probably give a lot of the benefits that model distillation has.
Overall, I’m very happy with the work I did competing in the Waymo Challenge. I beat the performance goal I set for myself. I learned a lot about an exciting area of computer vision. I learned a lot about the work that goes into adapting research models into real systems. Thanks to the folks at Waymo for putting this dataset and challenge together!
I’m currently looking for an ML position, so if this sort of thing is useful at your company, drop me a line!